MS-based Relative Quantitation
The Proteomics Resource Center (PRC) at The Rockefeller University masters a wide variety of mass spectrometry based quantitation techniques. Strategies includes label free quantitation, Tandem Mass Tags (TMT) and stable isotope labeling by amino acids in cell culture (SILAC), all which are most often used for relative quantitation. Relative comparison is in contrast to Absolute Quantitation. Absolute quantitation relies on titration experiments and/or stable isotopes and is generally more costly. The PRC is not set on any specific quantitation strategy but aim to apply the most appropriate tool for the asked question.
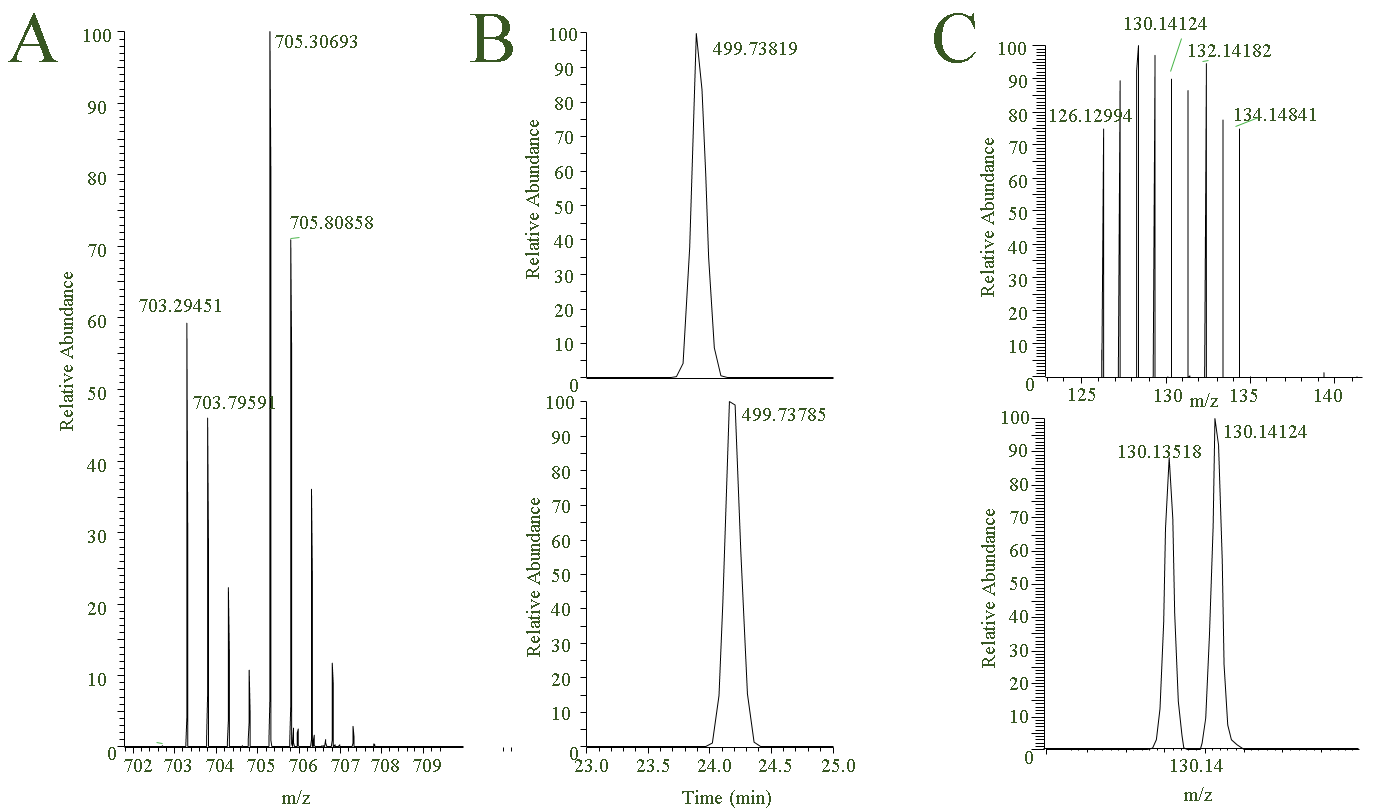
Most of our quantitative experiments are relative and examples of how mass spec signals are used to relative quantitate are shown below. Fig. 1A: SILAC-like experiment where relative signal differences between the peptide ion containing endogenous lysine (m/z 703.294) and ‘heavy lysine-4’ (m/z 705.306) is used to relative quantitate the peptide/protein under two conditions, Fig. 1B: label free type quantitation where absolute signal of a peptide is compared between samples. As is evident from the figure, the retention time of the peptide to be compared has slightly shifted between the two LC-MS experiments which can be a problem but a bigger problem is changing LC-MS performance, Fig. 1C: MS2 spectrum of Tandem Mass Tag experiment where 18 samples (18-plex) are compared simultaneously. Below are listed some notes regarding three commonly used quantitation strategies.

Figure 1. A: SILAC-like experiment using Lysine-4, B: Label free comparison, with upper panel being peptide X in sample A and lower panel is same peptide in sample B, C: Tandem Mass Tag (16-plex). Lower panel shows quantitation signals close in mass.
Metabolomic labeling with stable isotopes, of which SILAC is one such technique have the potential to provide be very accurate quantitation – if sample preparation variability between conditions can be minimized or is null. Metabolic labeling experiments can be used for pulse-chase studies. In our hands we, for complex samples, generally identify and quantitates less proteins with SILAC when compared to label free quantitation – using similar LC-MS conditions.
Label free (Data Dependent Acquisition, DDA) quantitation comes in many flavors and is based on either spectral counts or signal intensities – of which the latter generally is preferred by the PRC. One intensity based protein quantitation technique is designed to compare the same peptide/protein in different but comparable samples. This strategy is named ‘Label Free Quantitation’ (LFQ) and relies on (cross) normalization as well as strict filter criteria. In our hand LFQ provides sensitive relative protein quantitation when performed in replicate and importantly: when the samples are comparable.
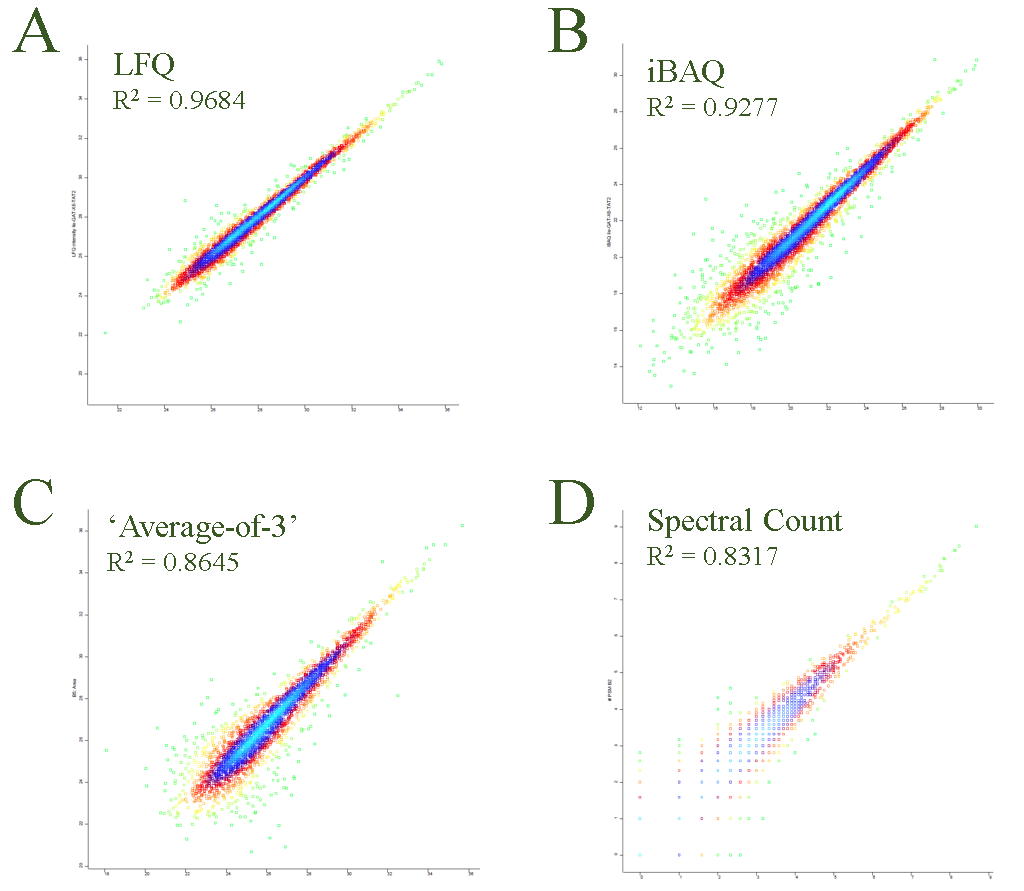
When the objective is to compare different proteins in the same sample, intensity Based Absolute Quantitation (iBAQ) 6 or ‘average-of-3-most-abundant-peptides’ 4 is often used as a proxy to access relative differences between different proteins. The iBAQ metric is normalized to the number of identifiable peptides for a given protein. Because ‘average-of-3-most-abundant-peptides’ is relying on only the 3 most abundant peptides this metric does not need ‘identifiable peptides adjustment’. The PRC are often using iBAQ or ‘Average-of-3’ protein quantitation strategies to compare samples where no replicates are available. iBAQ is also used for replicated analysis and tend to be more generous w/re. to number of matched proteins. Often we median-normalize iBAQ signals prior to calculating fold changes. In Figure 2 are shown LFQ (A), iBAQ (B), ‘average-of-3-most-abundant-peptides’ (C) and Spectral Counts (a.k.a. Peptide Spectrum Matches – PSM) (D) calculated for two replicated samples and presented as scatter plots. The best correlation is obtained using LFQ while Spectral Counts offers the poorest correlation.

Figure 2.Replicate set are compared using LFQ, iBAQ, Average-of-3-most-abundant-peptides and Spectral Count.
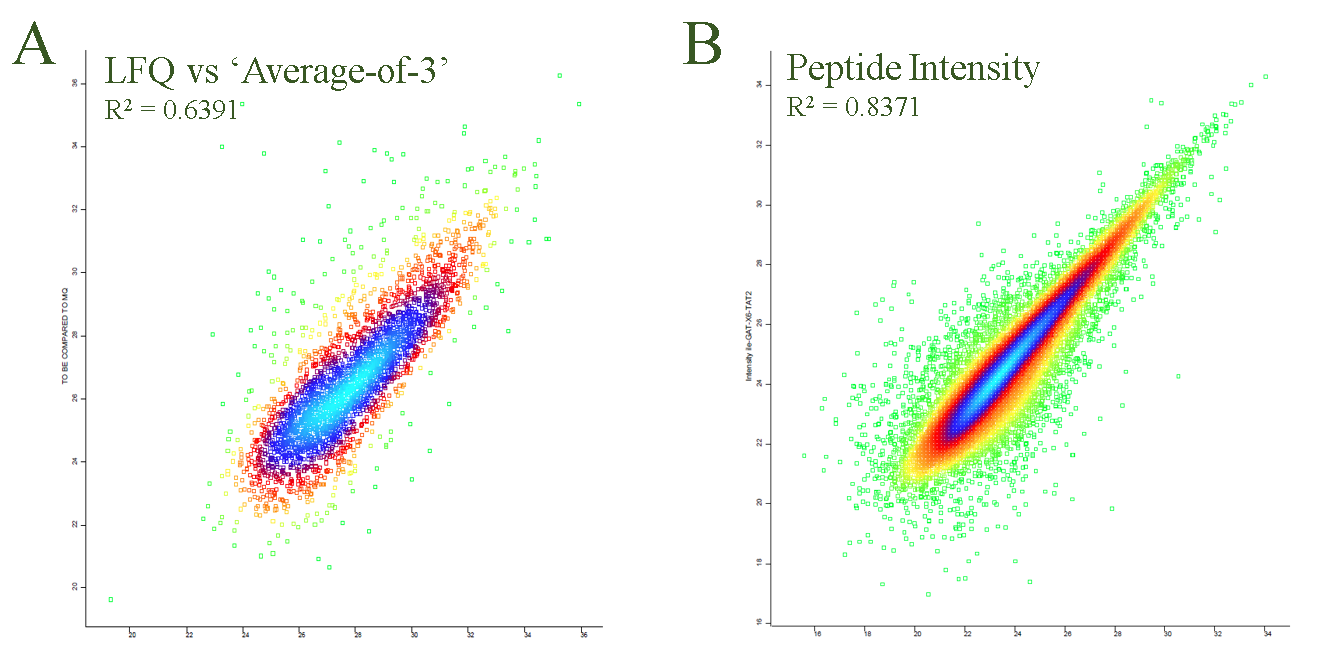
Correlation between the different intensity based quantitation strategies is decent – which is expected since the primary data are the same. In Figure 3A, as an example of the correlation, is plotted LFQ values vs ‘Average-area-of-3-most-abundant-peptides’.
Based on Figure 2 it is evident that label free protein quantitation can be robust and reproducible. However, when label free quantitation is used for peptide centric experiments exemplified by phosphorylation analysis, the correlation between replicates are less strong. One reason is because multiple measurement points (read: peptides) often are available for in protein quantitation and an median, sum or an average can help to ‘dampen’ the effect of outliers. For a peptide centric analysis most often only one measurement points is available per modification. In Figure 3B are plotted peptide intensities from two replicates. For reference, the measurement converted into the LFQ was presented in Figure 2A. The difference in correlation is significant and it is clear that for label free quantitation of peptides, lower signals result in higher variability.

Figure 3. Different metrics and label free peptide quantitation
Label free (Data Independent Acquisition, DIA(opens in new window)) quantitation. DIA 8 references to that ions does not need to be measured to be selected for fragmentation. In a DIA experiment the mass range monitored is split-in to smaller windows (4-40Th) where each window is subjected to fragmentation generating MS/MS spectra that are a composite of all the ions in the selected mass window. The generated fragment ions together are compared to a library of validated peptides and fragment ions matching the matched peptides are extracted and used for quantitation and ions within a specific mass-to-charge ratio (m/z) range are fragmented and analyzed simultaneously, allowing for a comprehensive and unbiased analysis of a sample, unlike traditional methods that select only a few ions to fragment at a time; essentially, it captures a “snapshot” of all detectable molecules within a given mass range, making it particularly useful for quantitative analysis in proteomics research

Figure 4. Classic Data Independent Acquisition (DIA)
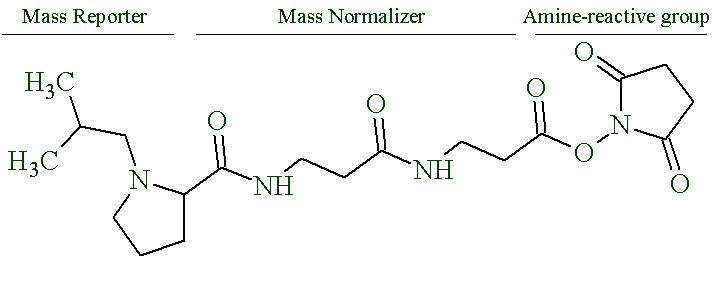
Tandem Mass Tags(opens in new window). A different class of labels is the isobaric tagging, from which a distinctive reporter group dissociates upon vibrational fragmentation. Isobaric labels, such as iTRAQ and TMT, are built from 3 parts; a peptide-reactive group, a balancing group and a reporter group. Each sample is labeled with a specific ‘plex’. For each ‘plex’, the isotopic distribution of the reporter group increases and is balanced accordingly by the isotopic distribution of the balancing group, so all tags carry the same net weight. The labeled samples are pooled and, upon fragmentation, the relative intensities of the reporter ions reflect the relative intensities of the peptides from the different samples. Since the same tagged peptides from different conditions are chemically identical and isobaric, they all appear as a single precursor, thereby increasing the sensitivity without increasing the complexity of the sample. To minimize ratio compressions due to co-fragmentation, the pooled sample is either fractionated prior to LC-MS and/or subjected to a second round of fragmentation (SPS-MS3) during analysis. While both ‘tricks’ greatly helps to minimize ratio compression, using SPS-MS3 decreases the duty cycle and less peptides are quantitated. Molecular structure of 16-plex Tandem Mass Tag produced by Pierce (ThermoFisher) is shown in Figure 4.

Figure 4. Proline based Tandem Mass Tag (TMTpro 16-plex).
Software for quantitation: Many different software’s are used by the PRC. Currently the software’s used by the PRC for mass spectrometry based quantitation are: Proteomeome Discoverer by Thermo Fischer Scientific combined with MASCOT 1, MaxQuant 2 and Skyline 3. ProteomeDiscoverer (PD) and MaxQuant 5 are comparable, though both quantitation strategies and search engines as well as preferred data filtering differs between the two. Results obtained by the two software’s are therefore not expected to be identical. Skyline is not a search engine but is used to extract signal preferentially for experiments designed as a targeted analysis. Benefits of ProteomeDiscoverer and MaxQuant are listed below:
ProteomeDiscoverer/MASCOT:
- Intuitive output that easy allows to manually validate matched spectra by studying the primary search input.
- Used for experiment not designed for a statistical analysis.
- Can be used together with MASCOT which is considered a ‘gold standard’ in peptide identification.
- In general and particular for not-fully tryptic peptides and multiple different post translational modifications, we find that the PD/MASCOT software, combined with Percolator 7(opens in new window), to be more sensitive than MaxQuant.
MaxQuant:
- Allows to normalize (or not) the in general very robust quantitative information.
- MaxQuant offers both LFQ and iBAQ metrics.
- ‘Match between runs’ is a feature of MaxQuant and is used to check for the signal of a peptide identified in one sample but not in another, by using high mass accuracy and a narrow retention time window. If such a signal is found it will be marked ‘by matching’ rather than ‘by MS/MS’.
- Designed for quantitative experiments.
References
- Perkins, D.N., Pappin, D.J., Creasy, D.M. & Cottrell, J.S. Probability-based protein identification by searching sequence databases using mass spectrometry data. Electrophoresis 20, 3551-3567 (1999).
- Cox, J. et al. Andromeda: a peptide search engine integrated into the MaxQuant environment. J Proteome Res 10, 1794-1805 (2011).
- MacLean, B. et al. Skyline: an open source document editor for creating and analyzing targeted proteomics experiments. Bioinformatics 26, 966-968 (2010).
- Silva, J.C., Gorenstein, M.V., Li, G.Z., Vissers, J.P. & Geromanos, S.J. Absolute quantification of proteins by LCMSE: a virtue of parallel MS acquisition. Mol Cell Proteomics 5, 144-156 (2006).
- Cox, J. et al. Accurate Proteome-wide Label-free Quantification by Delayed Normalization and Maximal Peptide Ratio Extraction, Termed MaxLFQ. Mol Cell Proteomics 13, 2513-2526 (2014).
- Schwanhausser, B. et al. Global quantification of mammalian gene expression control. Nature 473, 337-342 (2011).
- Kall, L., Canterbury, J.D., Weston, J., Noble, W.S. & MacCoss, M.J. Semi-supervised learning for peptide identification from shotgun proteomics datasets. Nat Methods 4, 923-925 (2007).
- Purvine, S., Eppel, J.T., Yi, E.C., Goodlett, D.R., Shotgun collision-induced dissociation of peptides using a time of flight mass analyzer, Proteomics 6, 847-50 (2003).